
---> SPECIAL PACKAGE DEAL <---
Unleash The Power Of Order Flow Analysis On Your Charts The Easy Way With The Orderflows 3 Pack
This Stuff Works! I'll Show You Exactly How In The Video Below...
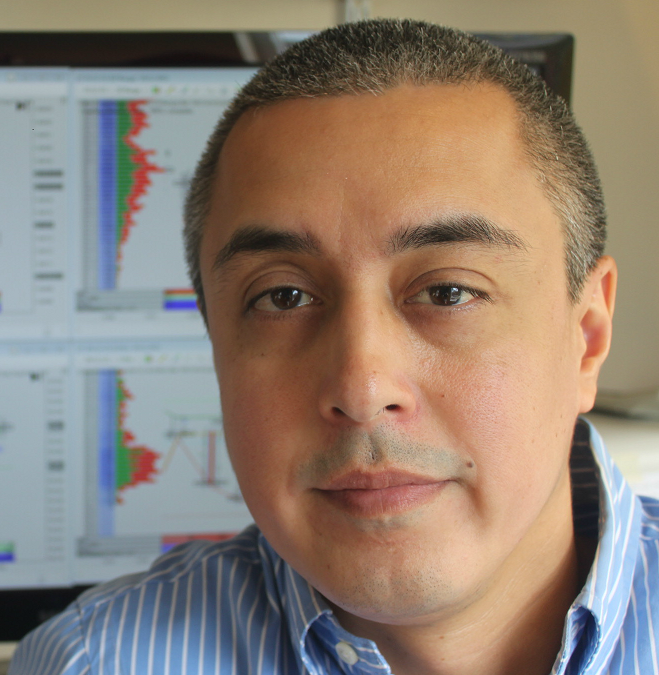
My name is Michael Valtos and I have spent 20 years as an institutional trader JP Morgan, Cargill, Commerzbank, EDF Man and Dean Witter Reynolds. The one thing that I have found to be single most important part of market analysis is order flow. What the market is doing right now. What the other market participants are doing right now affects what will happen next.
In 2015, I wrote the book on trading order flow, literally. A 150 page book called "Trading Order Flow." I also created the Orderflows Trader software which took the principles I taught in my book and put them on an order flow volume footprint chart. It was ground breaking.Now traders who wanted to learn how a professional trader used order flow had the chance to learn. However, not everyone was willing to transition to an order flow volume footprint chart for trading.
The traders who learned to read the order flow based on what was taught in my book enjoyed an advantage over others who were oblivious to the order flow. Most traders are price based. Order flow is price and volume based. A big difference and a big advantage to those using that information.
The traders who learned to read the order flow based on what was taught in my book enjoyed an advantage over others who were oblivious to the order flow. Most traders are price based. Order flow is price and volume based. A big difference and a big advantage to those using that information.
What I have done is taken three of my strongest setups and put them together in the Orderflows 3 Pack - Orderflows Market Flow Trader, Orderflows AV and Orderflows Tension indicators.
The first indicator of the Orderflows 3 Pack is the Orderflows Market Flow Trader which is based on one of my bread and butter trades which is the ratio and divergence trade. In which the order flow is analyzed and if it reaches a certain threshold a potential buy or sell is imminent. Coupled with a divergence in the order flow it creates a powerful trading opportunity.
On an Orderflows Trader Chart it was very easy to see:
On an Orderflows Trader Chart it was very easy to see:
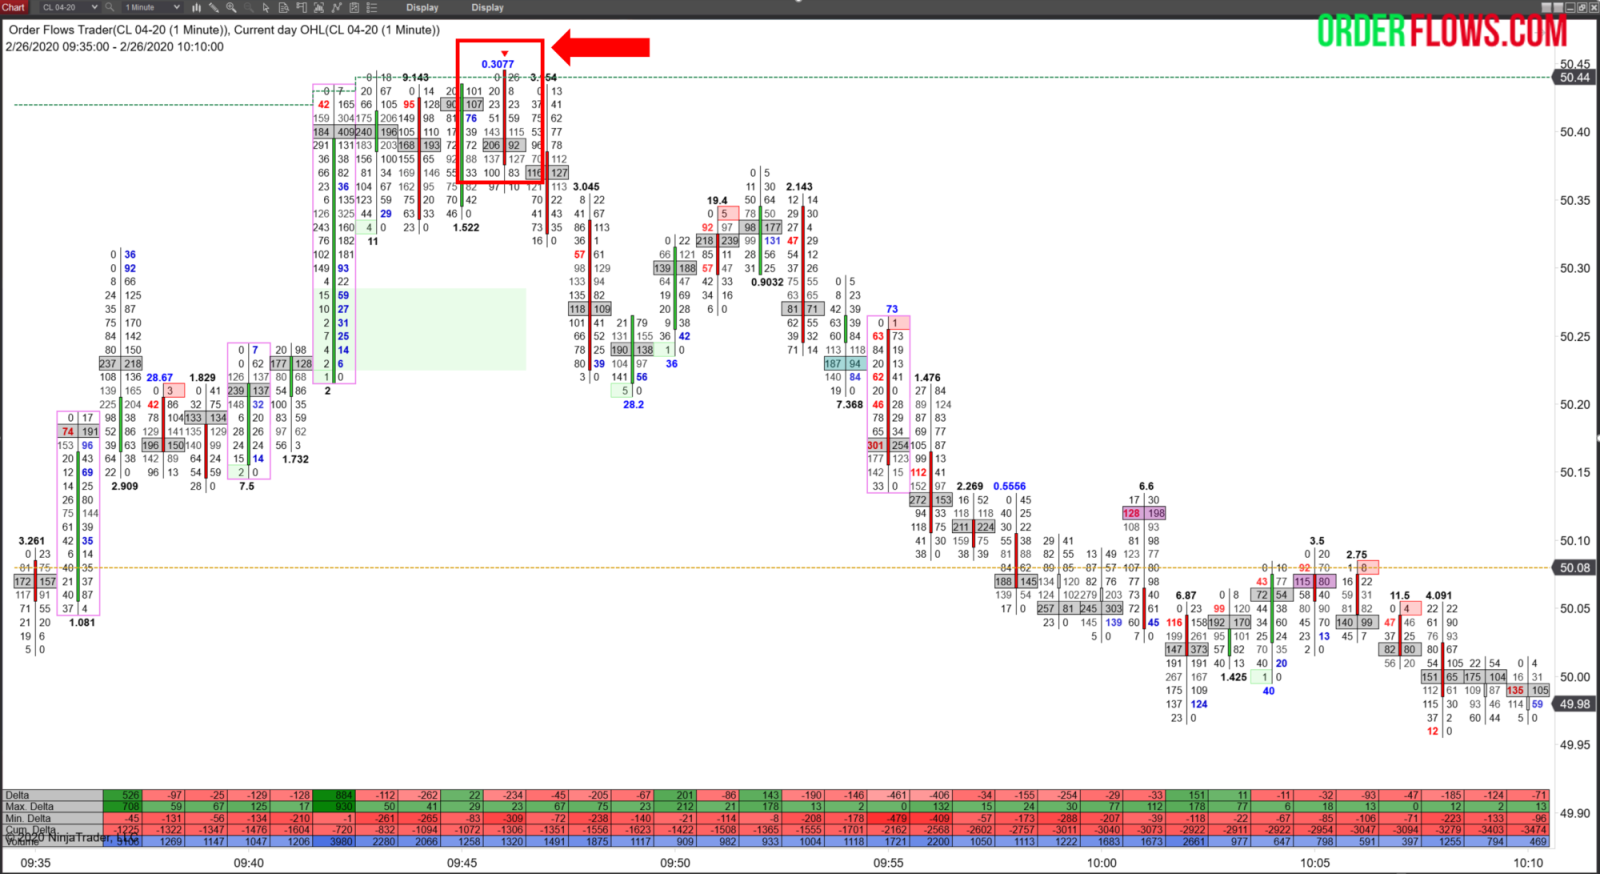
But the problem is not everyone uses a volume footprint chart nor do they know how to calculate the ratios and apply them. In fact, after releasing the Orderflows Trader with the ratios appearing on the chart, many other software companies reverse engineered the calculation and added them to their charting software. However, they missed the point in how to use them. Just having a number appearing on the chart is one thing, you have to know how to apply it. As a result many traders didn't know what they were doing with the ratio.
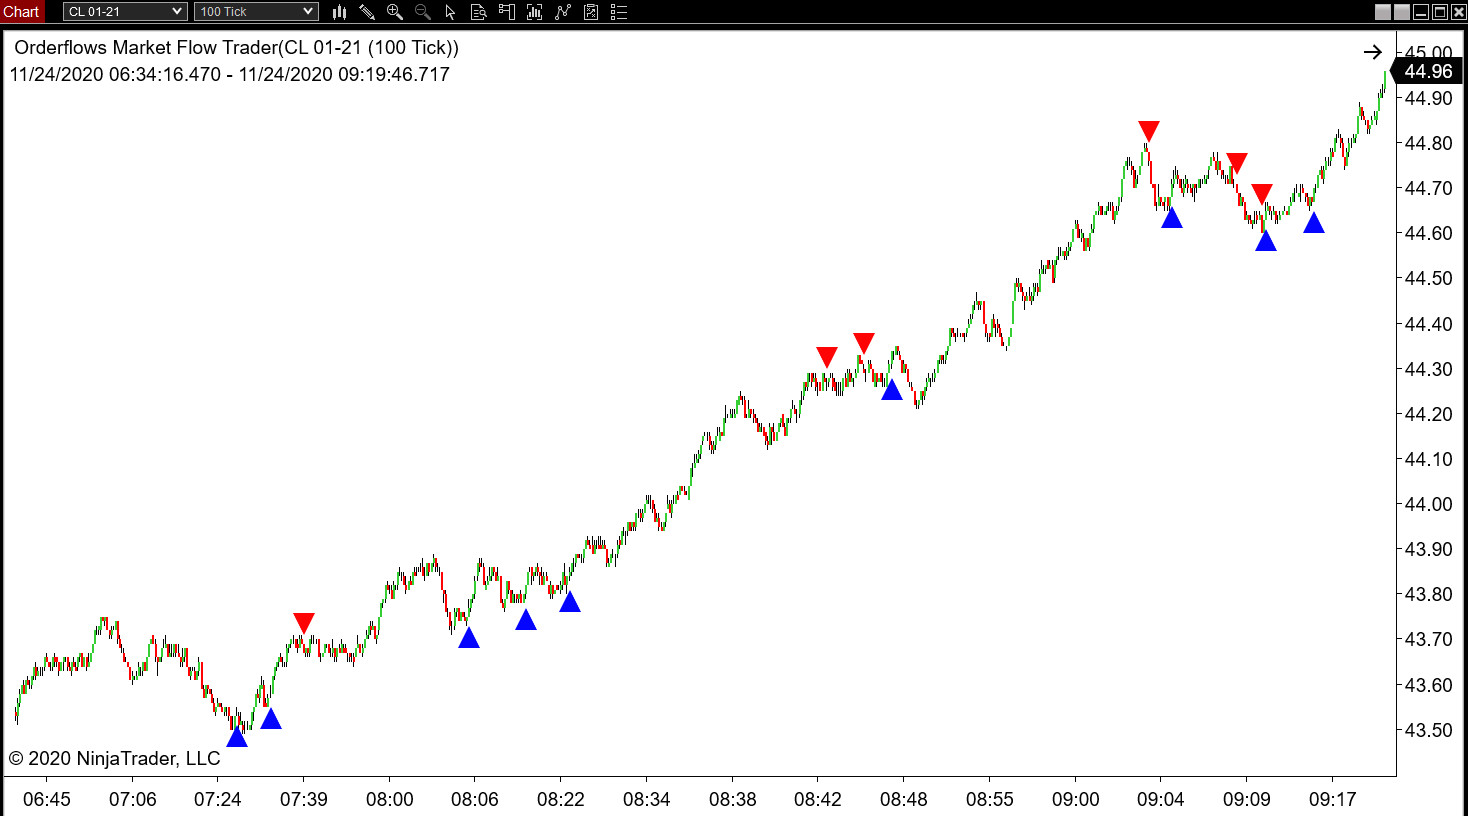
What I have done now is take it a step further and created a tool that takes the ratio and divergence, as well as a few other data points in the order flow and highlights to you where the good trades are.
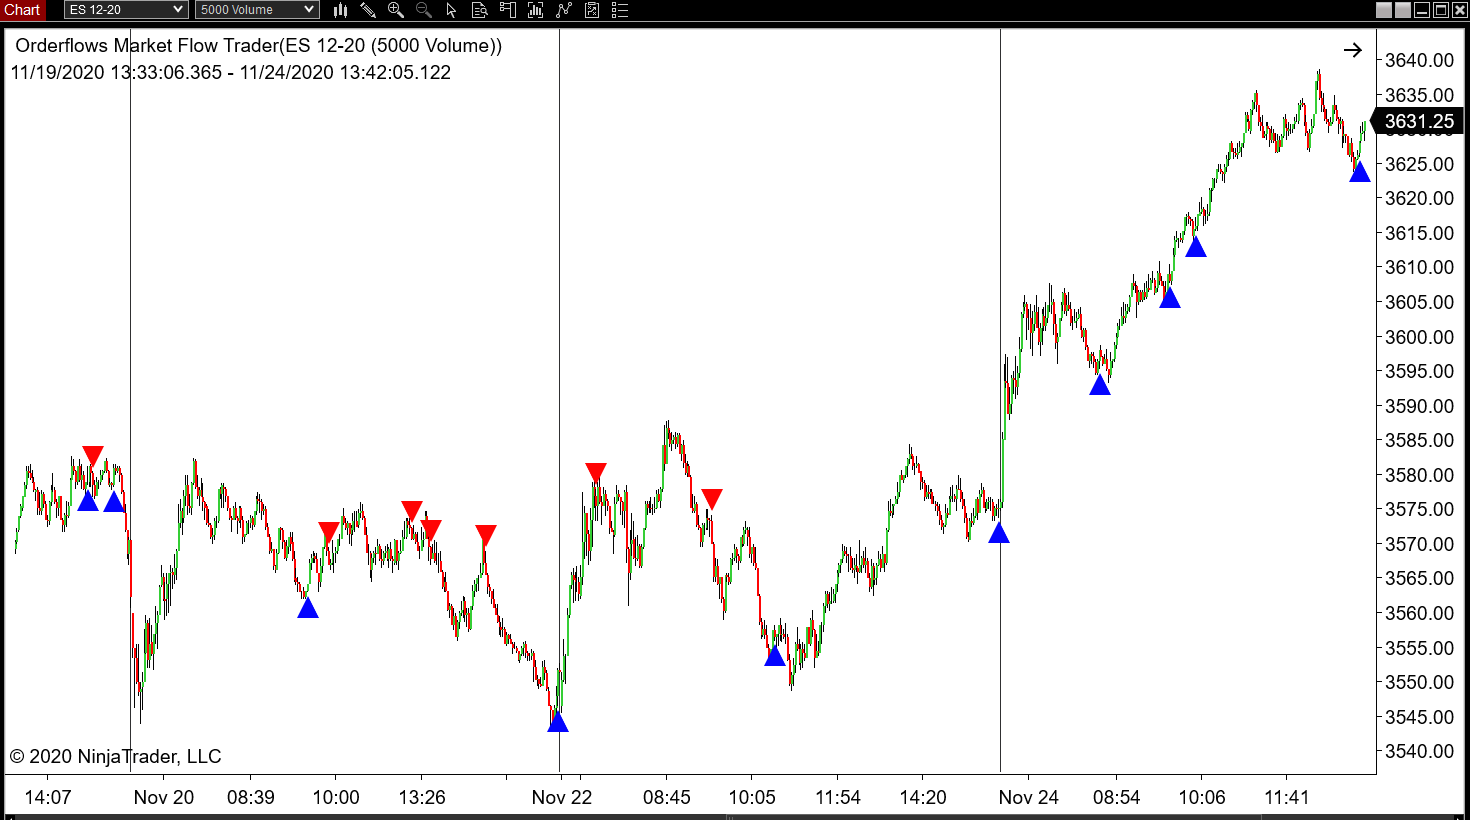
This is the Orderflows Market Trader indicator. The best part is it works on any chart type. An Orderflows Footprint Chart as well as a plain candlestick chart.
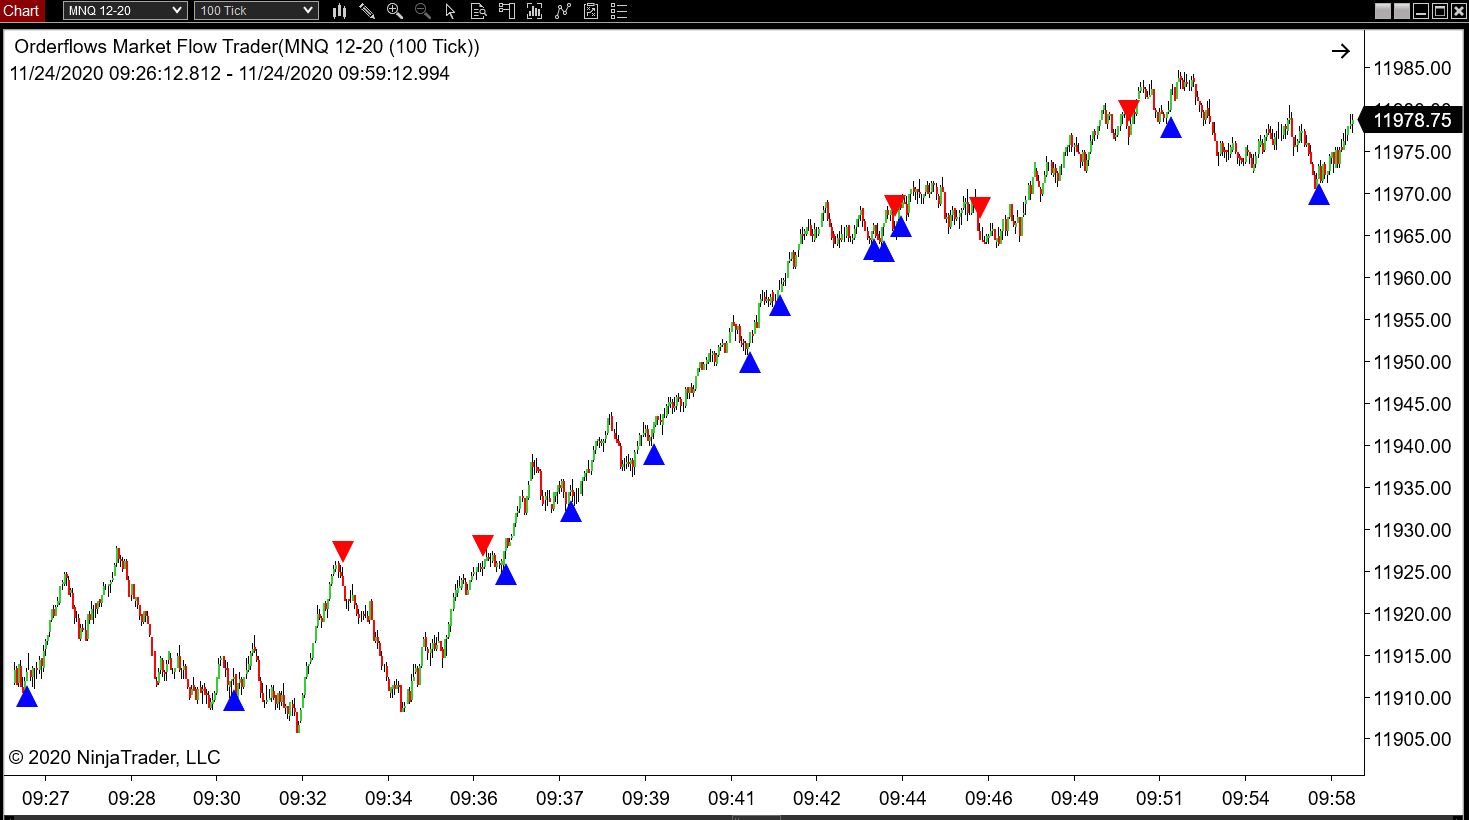
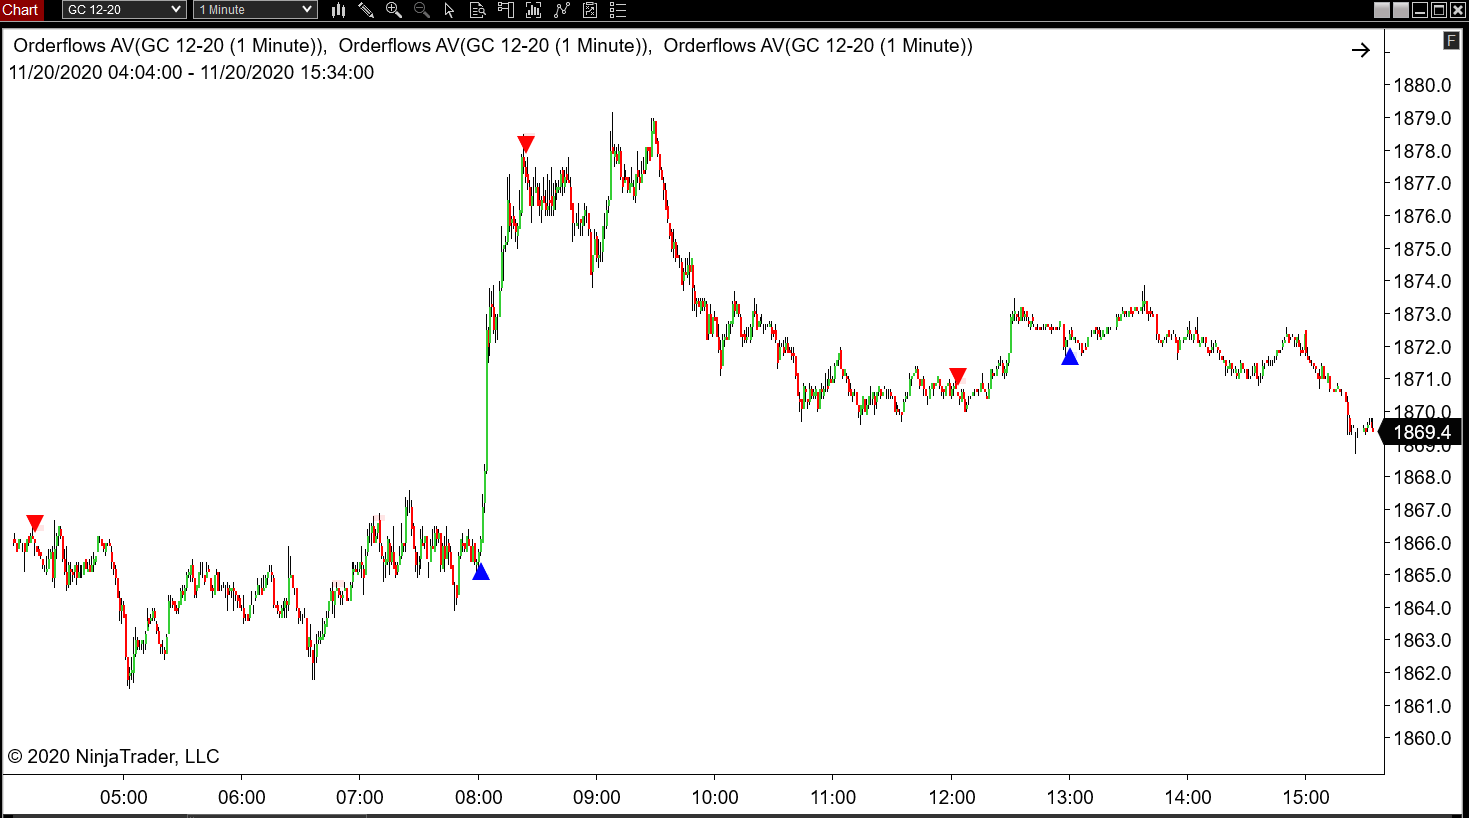
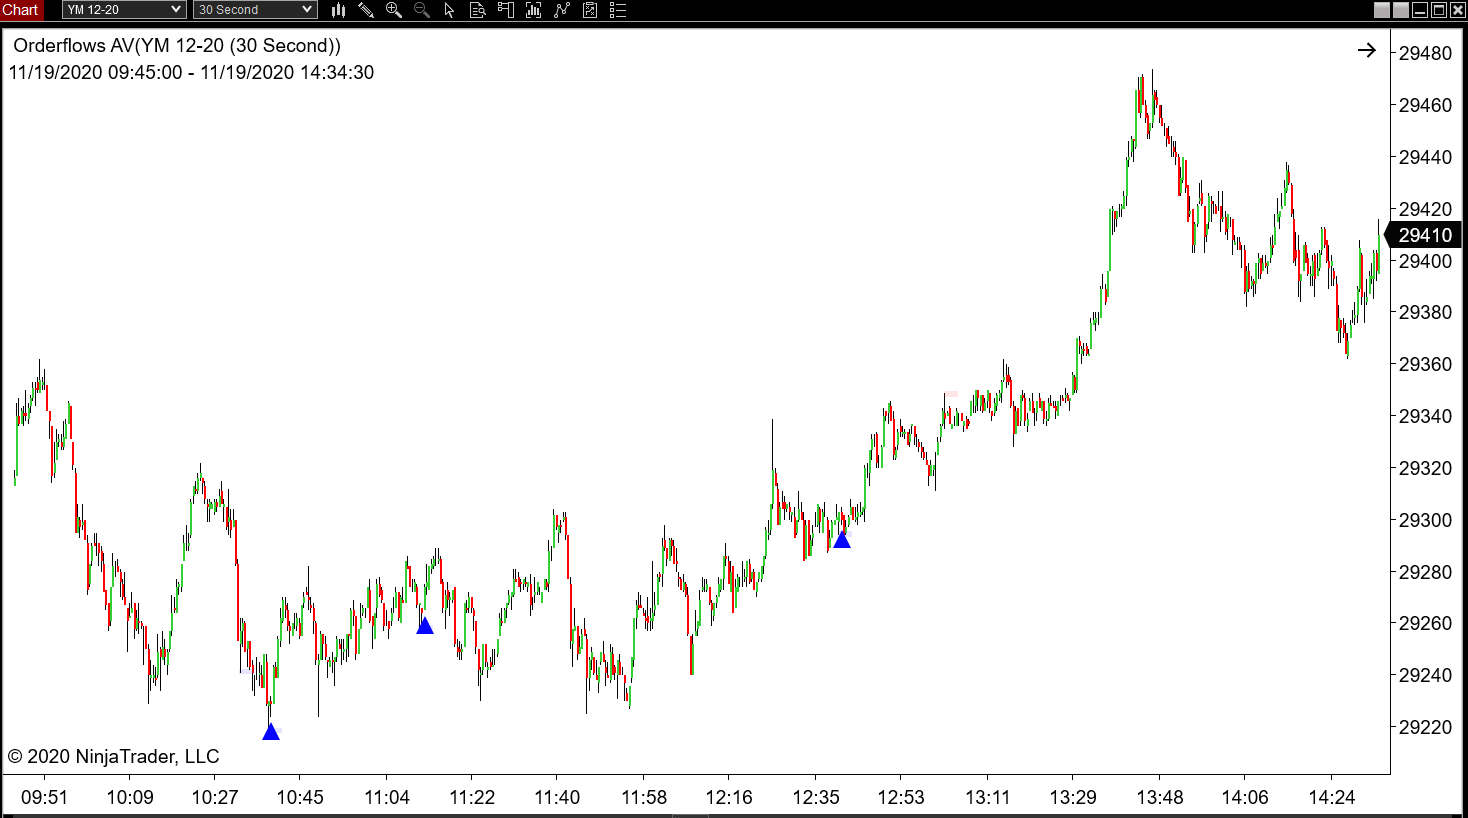
The second indicator in the Orderflows 3 Pack is the Orderflows AV. This indicator takes into account market balance, bar volume and price action.
The Orderflows AV is a reversal indicator and best applied to volatile markets such as NQ, MNQ, YM and Gold.
The Orderflows AV is a reversal indicator and best applied to volatile markets such as NQ, MNQ, YM and Gold.
What makes the Orderflows AV indicator unique is it also takes in account the value level in the bar relative to previous bars. When analyzing value of the bar relative to other bars, it find those bar where a new value area is being rejected by the market.
Markets move searching for new value and when it hits an extreme value level and rejects that level it often puts in a reversal.
This is a previously undisclosed analysis I have not covered in my book Trading Order Flow. If you are looking at a volume footprint chart it can be difficult to see:
Markets move searching for new value and when it hits an extreme value level and rejects that level it often puts in a reversal.
This is a previously undisclosed analysis I have not covered in my book Trading Order Flow. If you are looking at a volume footprint chart it can be difficult to see:
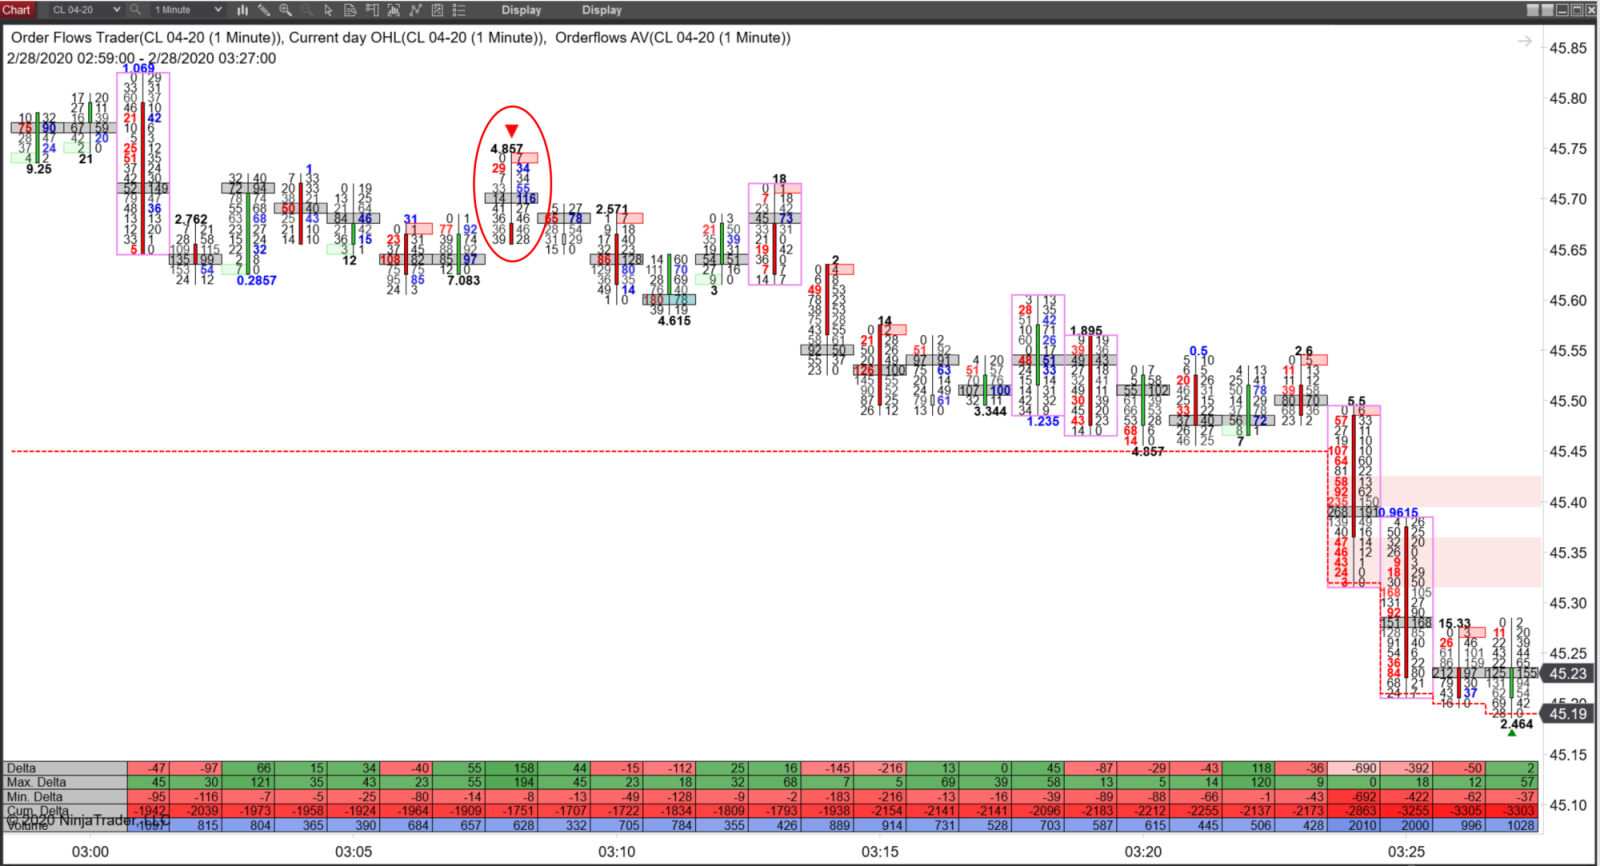
To make it easy to see, I created the Orderflows AV indicator so you can see it on volume footprint charts as well as normal candlestick charts.
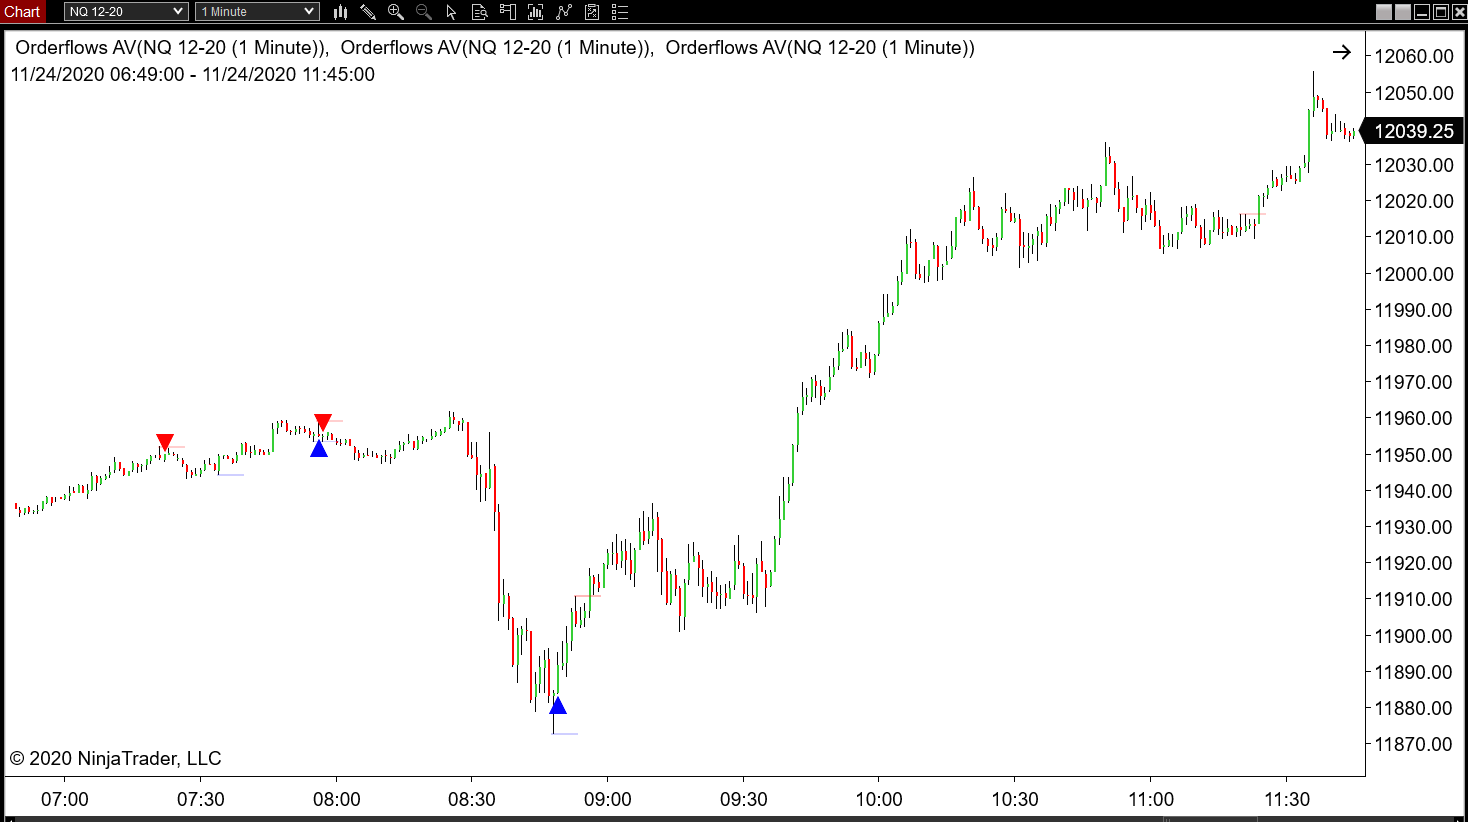
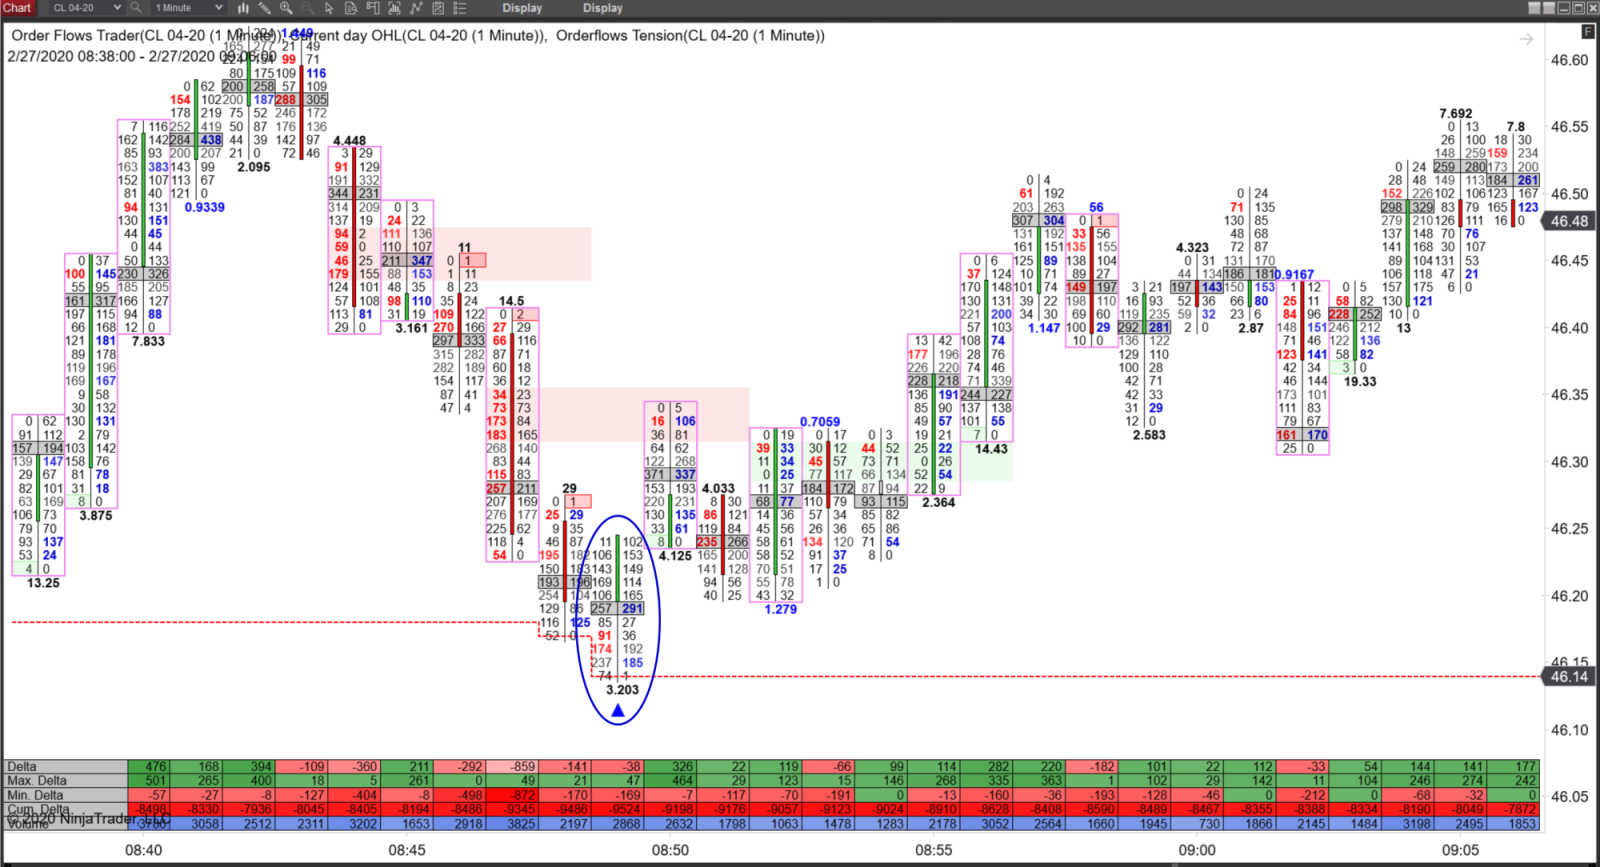
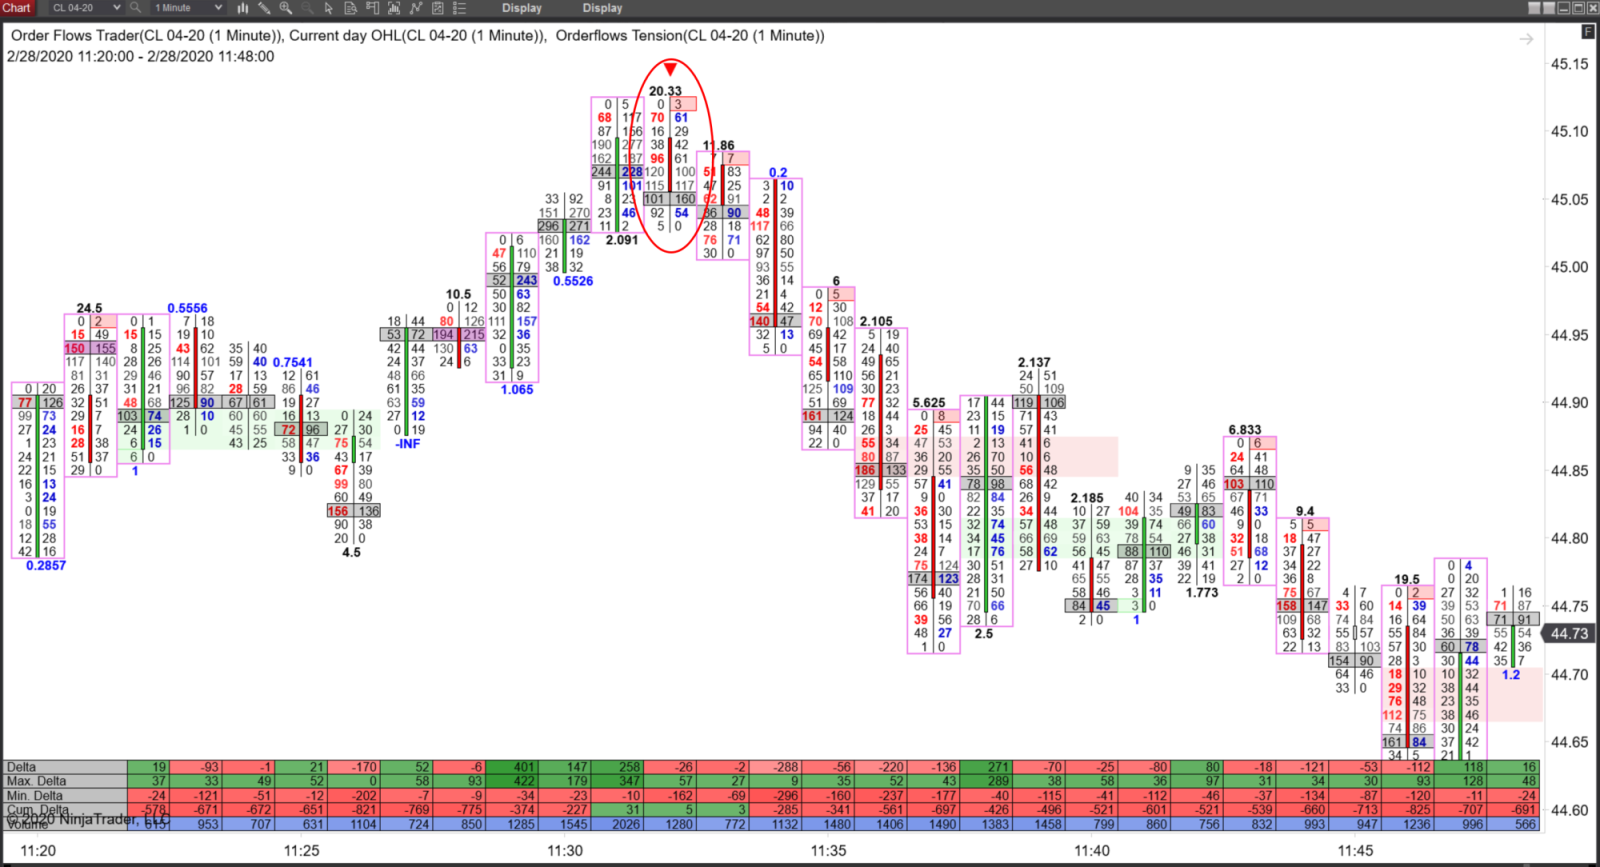
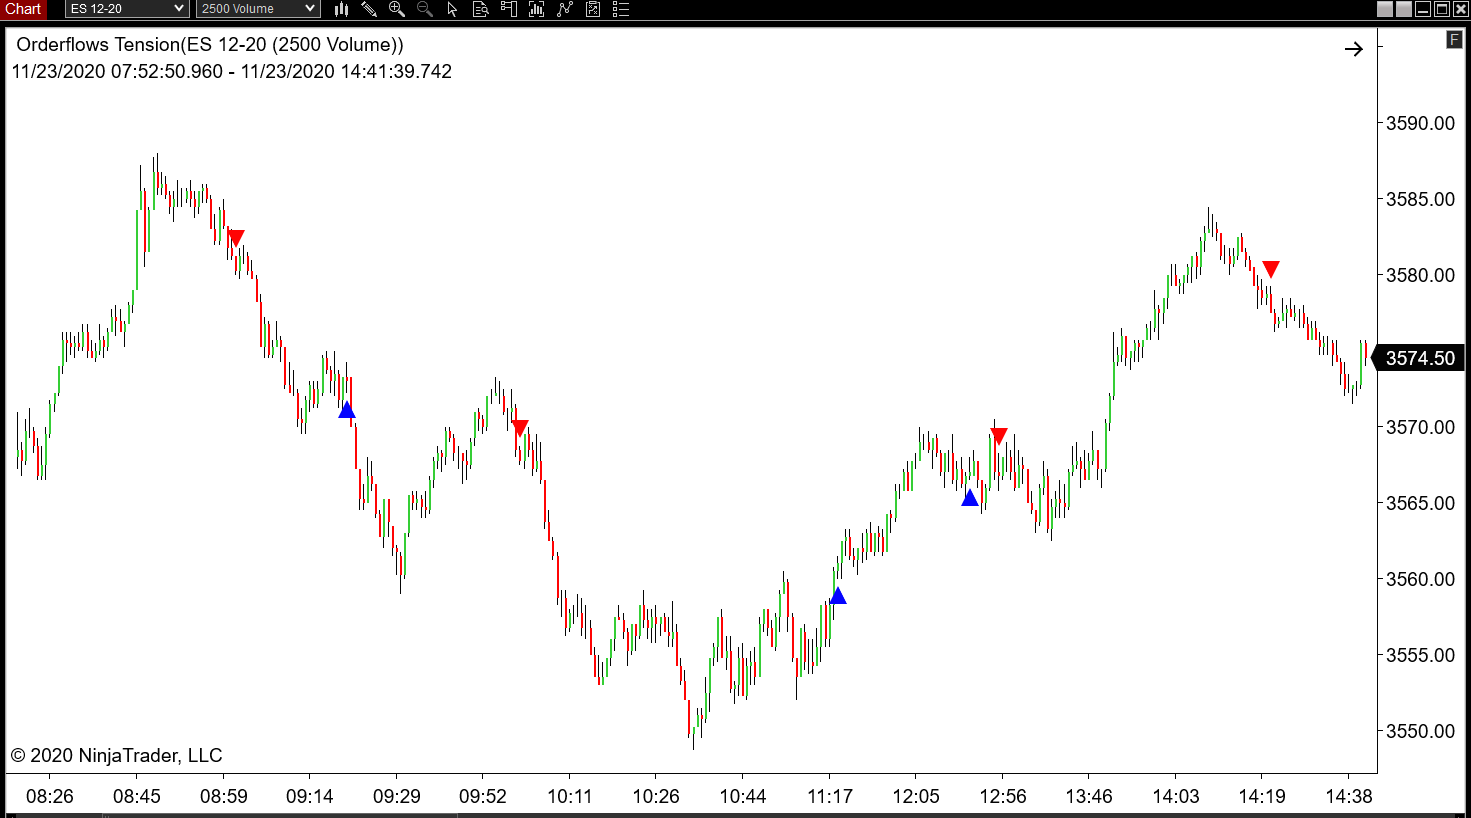
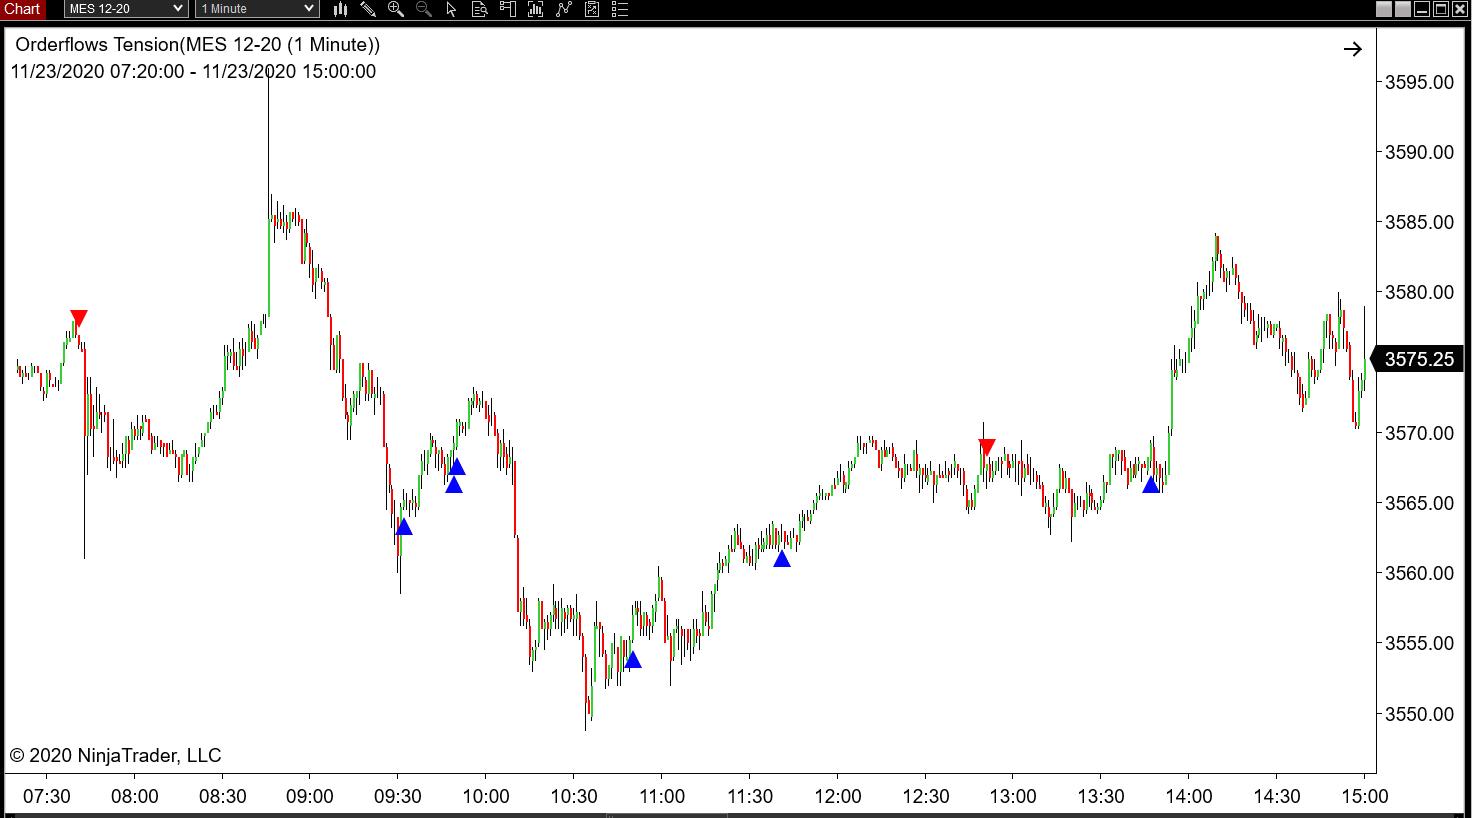
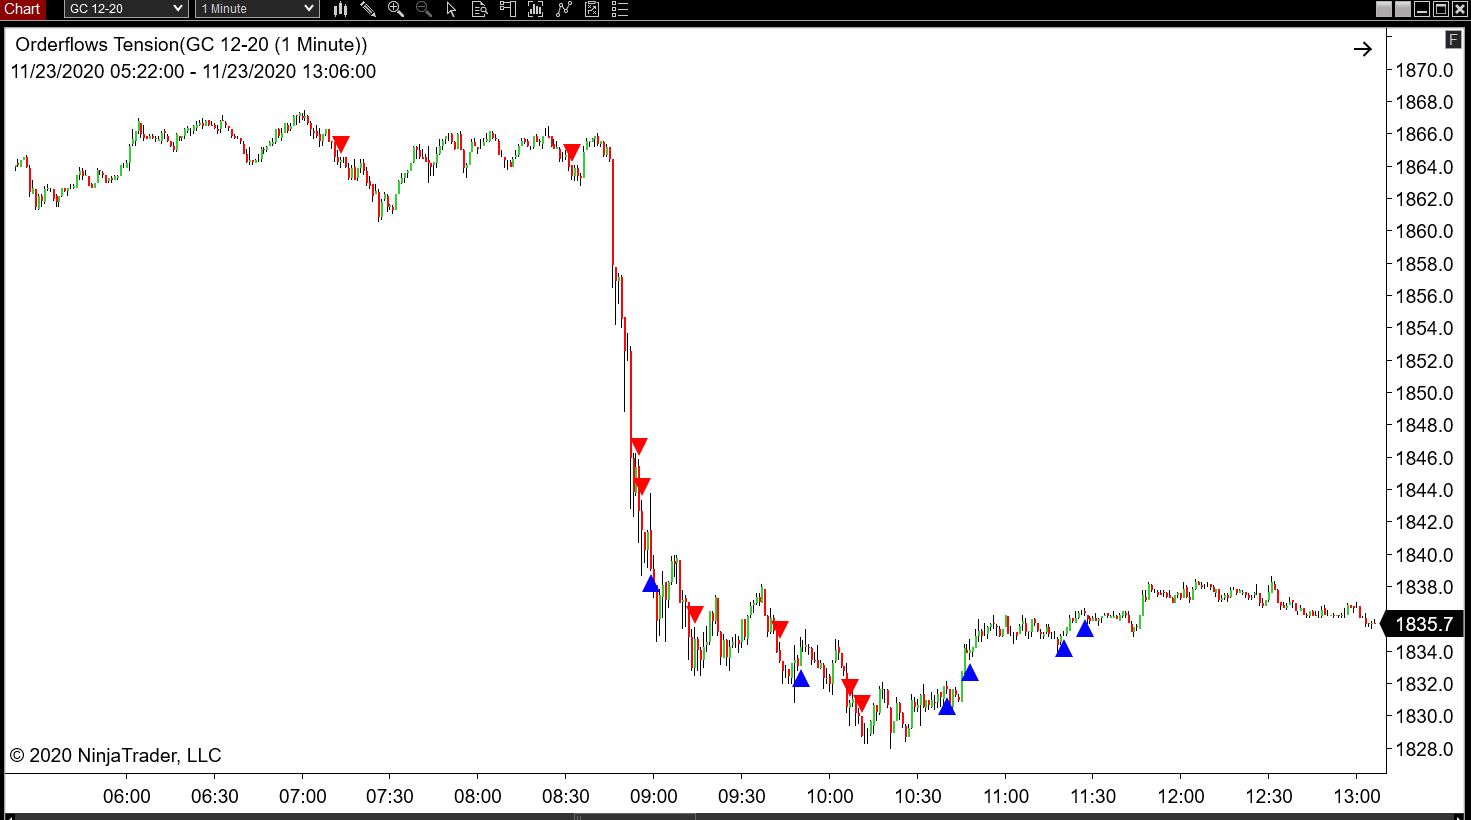
The third indicator in the Orderflows 3 Pack is the Orderflows Tension indicator. The Tension indicator measures the volume traded on bid against the volume traded on the offer and highlights the bars where there was a clear struggle between traders and one side one, either buyers or sellers.
Tension can appear anywhere at anytime. The Tension indicator can be used for finding reversals as well as confirming trends. I prefer to use it to find a reversal and then ride the trend.
Here is an Orderflows Trader Volume footprint chart. Can you tell if there is Tension in this bar?
Tension can appear anywhere at anytime. The Tension indicator can be used for finding reversals as well as confirming trends. I prefer to use it to find a reversal and then ride the trend.
Here is an Orderflows Trader Volume footprint chart. Can you tell if there is Tension in this bar?
To make it easier for a trader to take advantage of market tension, I created the Orderflows Tension indicator so that it will allow traders to take advantage of the order flow even if looking at a normal bar chart.
There are two ways to learn how to trade order flow. You can spend years learning by yourself and trying to figure out everything on your own. Or, the easy way, learn from a trader who has spent his career trading with order flow and use the tools he created for his own trading.
The Orderflows 3 Pack are tools I use everyday.
The Orderflows 3 Pack are tools I use everyday.
- How to look at any chart and instantly “see” the current market situation with crystal-clear understanding.
- The best, EXACT place to enter.
- No complicated calculations or guessing.
Stop Wasting Time & Money Trying To Figure Out
How It All Works, And Start Succeeding Now!
How It All Works, And Start Succeeding Now!
You can get the Orderflows 3 Pack which consists on three different indicators for a one time price of $900.
These indicators are not available separately. If they were the cost to purchase them separately would be $397 each, which would be $1191.
Clicking on the order link will redirect you to our secure payment processor page on PayPal.
Please allow 3 to 6 hours for us to process your order. We will email you all the necessary files as soon as your order is processed.
Please allow 3 to 6 hours for us to process your order. We will email you all the necessary files as soon as your order is processed.
FAQ's
Q. Is the Orderflows 3 Pack a footprint chart?
A. No. These are indicators that analyze the data
you would normally see on a footprint chart. The
software will run on footprint chart as well as a
normal candlestick chart. They were created to help
you see what is happening in the order flow.
Q. What platform do the indicators work on?
A. They are programmed for NinjaTrader 8. They run
on the paid version as well as the free version of NT8.
Q. I use Sierra Chart, are these indicators available
for Sierra Chart?
A. No. At the moment they are only available for NT8.
Q. I see you have different markets and different time
frames, do I need to follow so many different markets?
A. No, I show you different markets and different chart
types so you can see for yourself how the indicators work
under different conditions.
Q. Can I buy one of the indicators separately.
A. Yes, you can. The price to buy one is $350. You
are better off with this package deal.
Copyright 2020 - Orderflows.com - All rights reservedDisclaimer and Risk Disclosure:
CFTC Rules 4.41:
Hypothetical or Simulated performance results have certain limitations, unlike an actual performance record, simulated results do not represent actual trading. Also, since the trades have not been executed, the results may have under-or-over compensated for the impact, if any, of certain market factors, such as lack of liquidity. Simulated trading programs in general are also subject to the fact that they are designed with the benefit of hindsight. No representation is being made that any account will or is likely to achieve profit or losses similar to those shown.
Disclaimer:
This presentation is for educational and informational purposes only and should not be considered a solicitation to buy or sell a futures contract or make any other type of investment decision. Futures trading contains substantial risk and is not for every investor. An investor could potentially lose all or more than the initial investment. Risk capital is money that can be lost without jeopardizing ones financial security or life style. Only risk capital should be used for trading and only those with sufficient risk capital should consider trading. Past performance is not necessarily indicative of future results.
Risk Disclosure:
Futures and forex trading contains substantial risk and is not for every investor. An investor could potentially lose all or more than the initial investment. Risk capital is money that can be lost without jeopardizing ones’ financial security or life style. Only risk capital should be used for trading and only those with sufficient risk capital should consider trading. Past performance is not necessarily indicative of future results.
Hypothetical Performance Disclosure:
Hypothetical performance results have many inherent limitations, some of which are described below. no representation is being made that any account will or is likely to achieve profits or losses similar to those shown; in fact, there are frequently sharp differences between hypothetical performance results and the actual results subsequently achieved by any particular trading program. One of the limitations of hypothetical performance results is that they are generally prepared with the benefit of hindsight. In addition, hypothetical trading does not involve financial risk, and no hypothetical trading record can completely account for the impact of financial risk of actual trading. for example, the ability to withstand losses or to adhere to a particular trading program in spite of trading losses are material points which can also adversely affect actual trading results. There are numerous other factors related to the markets in general or to the implementation of any specific trading program which cannot be fully accounted for in the preparation of hypothetical performance results and all which can adversely affect trading results.
Thanks for subscribing. Share your unique referral link to get points to win prizes..
Loading..
